Integrate Well Log Analysis with AI-Enabled Workflows
Integrate well log analysis with AI-enabled workflows
Well logs provide ground-truth insight into rock properties, making them essential to subsurface interpretation. Paradise® includes a unified Well Analysis Dashboard that brings well log analysis and seismic interpretation together in one place. This powerful dashboard encompasses powerful analytical capabilities –
- Lithofacies Prediction,
- ML-based Lithofacies Log Generation, and
- Well Log Histograms
– all designed to seamlessly integrate well data with machine learning for faster reservoir characterization. The result is a cleaner workflow that empowers exploration and asset teams to generate high-fidelity interpretations quickly and make decisions with greater confidence.

Seamless Integration of Well and Seismic Data
The Paradise Well Analysis Dashboard provides an intuitive environment where well logs, petrophysical data, and seismic-derived machine learning results can be analyzed side by side. Geoscientists can easily load their well logs (with formation tops, curves, etc.) and view them in context with the Paradise multi-attribute classifications or other seismic attributes at the borehole location. This means you can correlate machine learning classification outcomes directly with traditional well logs and cross-sections.
- Bridge the gap between subsurface models and actual well data.
- Visually overlay interpreted seismic facies (g. SOM* clusters) and even fault detection results along the well path, revealing how lithology and structure intersect at each well.
- Accelerate QC and calibration of machine learning results against known geology.
This integrated approach gives interpreters greater confidence in identifying reservoir intervals and subtle features.

Integration of seismic, well logs, lithofacies prediction, and SOM neurons. The results assign probabilities to the 4 lithofacies shown in the legend.
Well Log Histograms – Visualize and Calibrate Data Distributions
The new Well Log Histograms tool provides a powerful way to analyze well log data statistically and derives insights that inform seismic interpretation. With a few clicks, Paradise will generate histograms showing the distribution of any well log values (such as porosity, clay content, or production indicators) to help interpreters spot trends and outliers. This is extremely useful for quality control and understanding the range of rock properties present in the field. Moreover, the histogram feature doubles as a “hit count” analysis for SOM neurons or ML classes within given depth intervals.
In other words, you can visualize how frequently each machine learning cluster (from a seismic SOM classification) appears in a particular interval of a well or across the entire well.


This capability is invaluable for calibrating the ML results: for example, one can quickly identify which clusters correspond to known productive zones versus non-productive zones by comparing their occurrence in intervals defined as “net reservoir” vs “non-reservoir” based on petrophysical cutoffs. Such statistical correlations between ML neurons and reservoir properties help validate and refine the interpretation – essentially bridging the gap between pattern recognition and physical rock data.
The Well Log Histogram tool thus adds a quantitative lens to the analysis, enabling geoscientists to uncover relationships between seismic-driven classes and actual well log measurements at a glance. This leads to more insightful conclusions about reservoir quality and distribution, grounded in both seismic and well data.
ML-Based Lithofacies Log Generation – Smart Well Log Creation
The Machine Learning-based Lithofacies Log Generation in Paradise is a tool for creating new lithofacies logs from your existing well log data. This capability lets geoscientists derive discrete lithology or facies curves using either K-means ML clustering algorithms or rule-based petrophysical cutoffs.
Take a suite of conventional logs (porosity, resistivity, gamma, etc.) and automatically classify the log responses into facies categories. The result is a new log, indexed to depth, that highlights different lithologies or reservoir units as inferred from the data. Alternatively, if you have known cutoff criteria (such as Vclay < X% and Porosity > Y for “net sand”), the tool can apply those rules to generate a facies log.
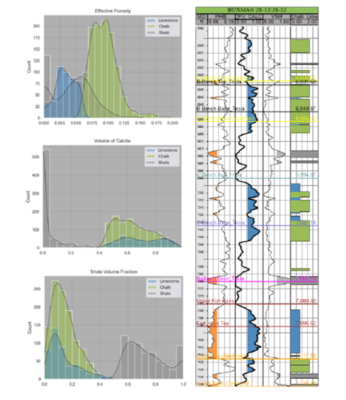
An interactive analysis dashboard guides you this process, allowing for review of histograms and cluster statistics to understand and refine the defined lithofacies. The generated lithofacies logs can be used directly within Paradise (feeding into the Lithofacies Prediction described here) or exported for use in other interpretation platforms. By automating lithology log creation, this feature ensures consistency across wells and removes tedious manual classification.

(Left) Probability Distribution Functions of logs to assign lithologies. (Right) Views of well logs and neurons used as an initial QC check. Highlights different lithologies or reservoir units as inferred from the data.

Well Log Cross Plots
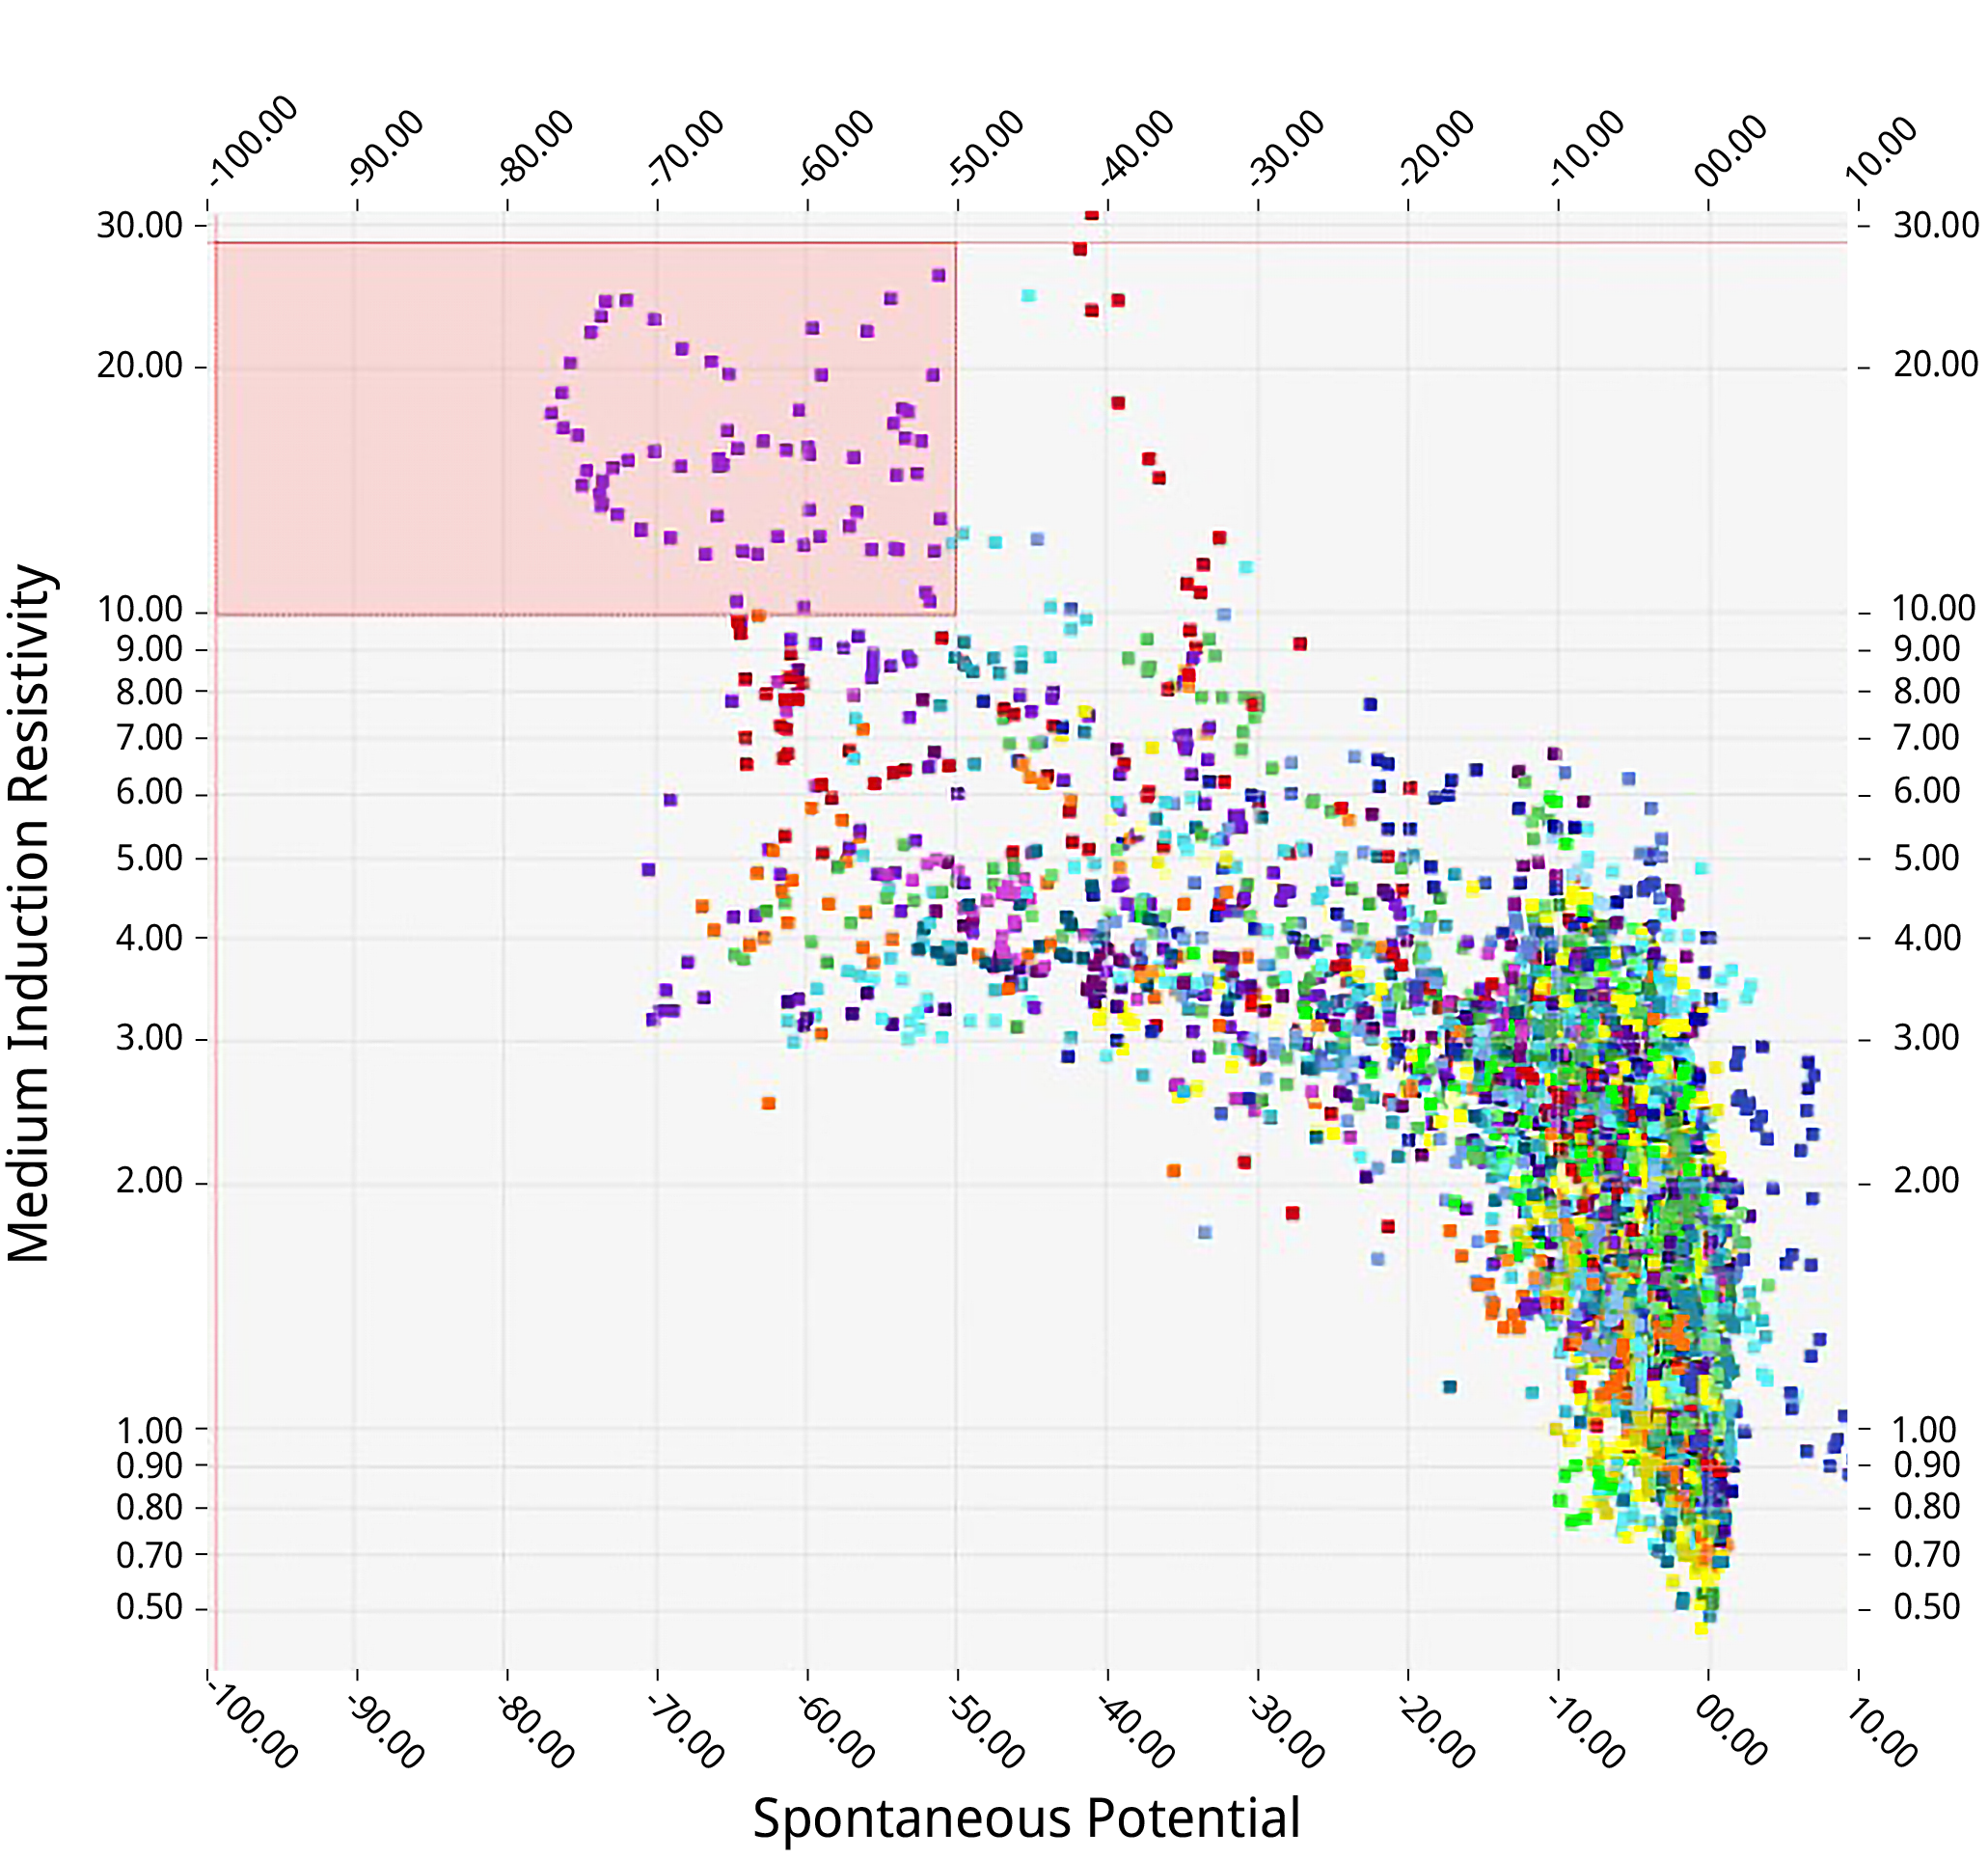
The Well Log Cross Plot tool graphically displays the relationship between log curves and machine learning results, revealing pay intervals on the Well Cross Section depth track. Cross Plots highlight specific neurons in conjunction with log values most associated with production. Apply the Well Cross Plot tool to obtain these results quickly and easily:
- Bring seismic data resolution to borehole log and lithofacies scale in feet/meters via attributes, Machine Learning (ML) Stratigraphic Analysis using Self-Organizing Maps (SOMs), and ML Geobodies
- Extract seismic data along the borehole as attributes, SOM results, or probability results, and easily modify the associated color bars
- Display digital well logs, TD charts, formation tops, and cross-sections in straightforward displays
Apply the companion Well Log Viewer to analyze logs versus machine learning results, and identify which neurons correspond to reservoir petrophysical properties. Examine different ML topologies versus well logs to determine which topology is optimum. Then, convert the classes corresponding to production into ML geobodies.
High-Fidelity Interpretation, Streamlined Workflows
By combining these new capabilities, Paradise elevates the way geoscientists perform integrated interpretations. The Well Analysis Dashboard puts everything in one place – from creating lithofacies logs, to visualizing log/seismic overlays, to generating facies predictions and statistical charts – all within a unified interface. This consolidation means less time jumping between software and more time extracting insights. Geoscience teams can iterate rapidly: e.g. generate a lithofacies log, feed it into a prediction, and immediately see the results in context with the well and seismic data, then adjust parameters and repeat – a workflow that used to take days can now happen in hours.
The outcome is a high-fidelity interpretation that honors both well and seismic information, helping to de-risk prospects and characterize reservoirs with greater accuracy. Paradise’s latest release empowers exploration and asset managers to integrate their data and analyses more tightly than ever, driving projects forward faster and with greater confidence in the results.

Supporting resources on well logs and machine learning
Learn how geoscientists are using the Paradise® AI Workbench to verify well log data
Applying ML Technologies in the Niobrara Formation to Produce an Integrated Classification Volume Calibrated to Wells
Identify Reservoirs by Combining Machine Learning, Petrophysics, and Bi-variate Statistics
See it in action
Schedule your introductory call to discuss what AI can do for you.
Explore the results of AI Fault Detection in our short demo video, or contact our team for a hands-on walkthrough using your data.
Step 1: Discovery Call – Schedule Now
Schedule your introductory call to discuss what AI can do for you.
Start your AI implementation journey today with a short, 30-minute introductory call. We will listen carefully to your objectives and design a path for your team that realizes tangible benefits.


