Lithofacies Prediction
Paradise Lithofacies Prediction Self-Guided Demo
Walk through a demo of the Paradise AI Lithofacies Prediction capabilities, which produces results in a fraction of the time compared to traditional methods.

Paradise Lithofacies and Fault Prediction – Machine and Deep Learning Applications in the Permian Basin
Speaker: Robin Dommisse, Senior Geomodeling Advisor, Bureau of Economic Geology, University of Texas at Austin
Accurate 3D reservoir characterization models of subsurface reservoirs rely on the maximum extraction of knowledge from the 3D seismic and well log data sets. In this presentation we discuss a new machine learning (ML) powered methodology for 3D lithofacies prediction of clinoform ooid grainstones in a Midland Basin carbonate CCUS reservoir. This new approach is faster than traditional seismic inversion techniques, leveraging the power of Self Organized Maps (SOM), an unsupervised form of machine learning. Using SOM, we create detailed 3D volumes of classified data down to a single seismic sample interval. These volumes are then combined with lithofacies from well logs, merging two independent data sources for more accurate predictions. In a second example we show how to quickly generate fault probability volumes for several 3D seismic surveys in the Permian Basin. The AI-based fault detection workflow discussed here uses a combination of supervised Deep Learning (DL) and unsupervised Machine Learning (ML) technologies to produce fault geobodies which are converted to fault planes for use in 3D sealed, structural geomodels.
Supporting resources on lithofacies prediction using Paradise

Comparison to seismic inversion for lithofacies prediction
Paradise offers a novel data-driven, machine-learning methodology for predicting lithofacies from seismic and well data that is unique in the industry. Unlike deterministic approaches, machine learning-based Lithofacies Prediction does not require seismic and well data to conform to physical models.
It reduces ambiguity and non-uniqueness by incorporating multiple attributes into the analysis and enhances interpretability by categorizing each seismic sample with the most probable lithofacies and their associated probability. The results create a litho-stratigraphic model of the subsurface by integrating two independent data sources: natural clusters of seismic attributes and lithofacies from well-log data. This model delineates lithofacies at a granular level, both vertically and horizontally, within each seismic sample. The methodology is being applied in geologic settings worldwide and is proving efficient and effective.
The alternative ML approach to reservoir characterization by Geophysical Insights has these technical advantages over seismic inversion for lithofacies prediction, saving time and money:
- Process is not deterministic – does not require data to match physical models
- No requirement to determine the wavelet and low-frequency trend in the data, which are non-trivial
- Employs multiple seismic attributes in ML clustering that identify natural patterns in the data relating to lithology
- Works on thin and thick beds as ML clustering is done at the seismic sample interval, below the wavelets resolution limit
- Neurons generated by SOM have some of the characteristics of inverted data; they map intervals, not just stratigraphic interfaces
Contact us to schedule a 15-minute consultation about applying ML-based Lithofacies Prediction to your area of interest. More on the process is outlined in the images below.
Amplitude Trace and Seismic Attributes Computed from Amplitude

Multidimensional vectors input into SOM are obtained by taking the same time/depth sample for all attributes. Each sample is classified by a neuron, which provides interpretable data below the seismic wavelet resolution.
“SOMs find facies patterns first, which can then be labeled by the geologist using log data or geologic analogs. The flexible nature of SOMs makes them a useful unsupervised approach for seismic facies analysis, particularly where there may be limited well control.”
– Dr. Heather Bedle, assistant professor at the University of Oklahoma and principal investigator for the Attribute-Assisted Seismic Processing & Interpretation (AASPI) Consortium
SOM Topology with Seismic Amplitudes and Lithofacies

The SOM topology map at left corresponds to the SOM neurons in the middle track. The left-most well track shows the seismic trace at the well location. The right-most trak is the lithofacies computed from well logs. Formation thicknesses observed in the lithofacies are smaller than a seismic trough (reference the shallow clays).
Four Lithofacies Estimated from Petrophysical Evaluation of Five Niobrara Wells

The lithofacies from the well shown in the right-most track of Figure 2 is the well-log representation of the lithofacies shown here as PDF plots. The economic importance of the play is evidenced by the appearance or hydrocarbons in all lithofacies.
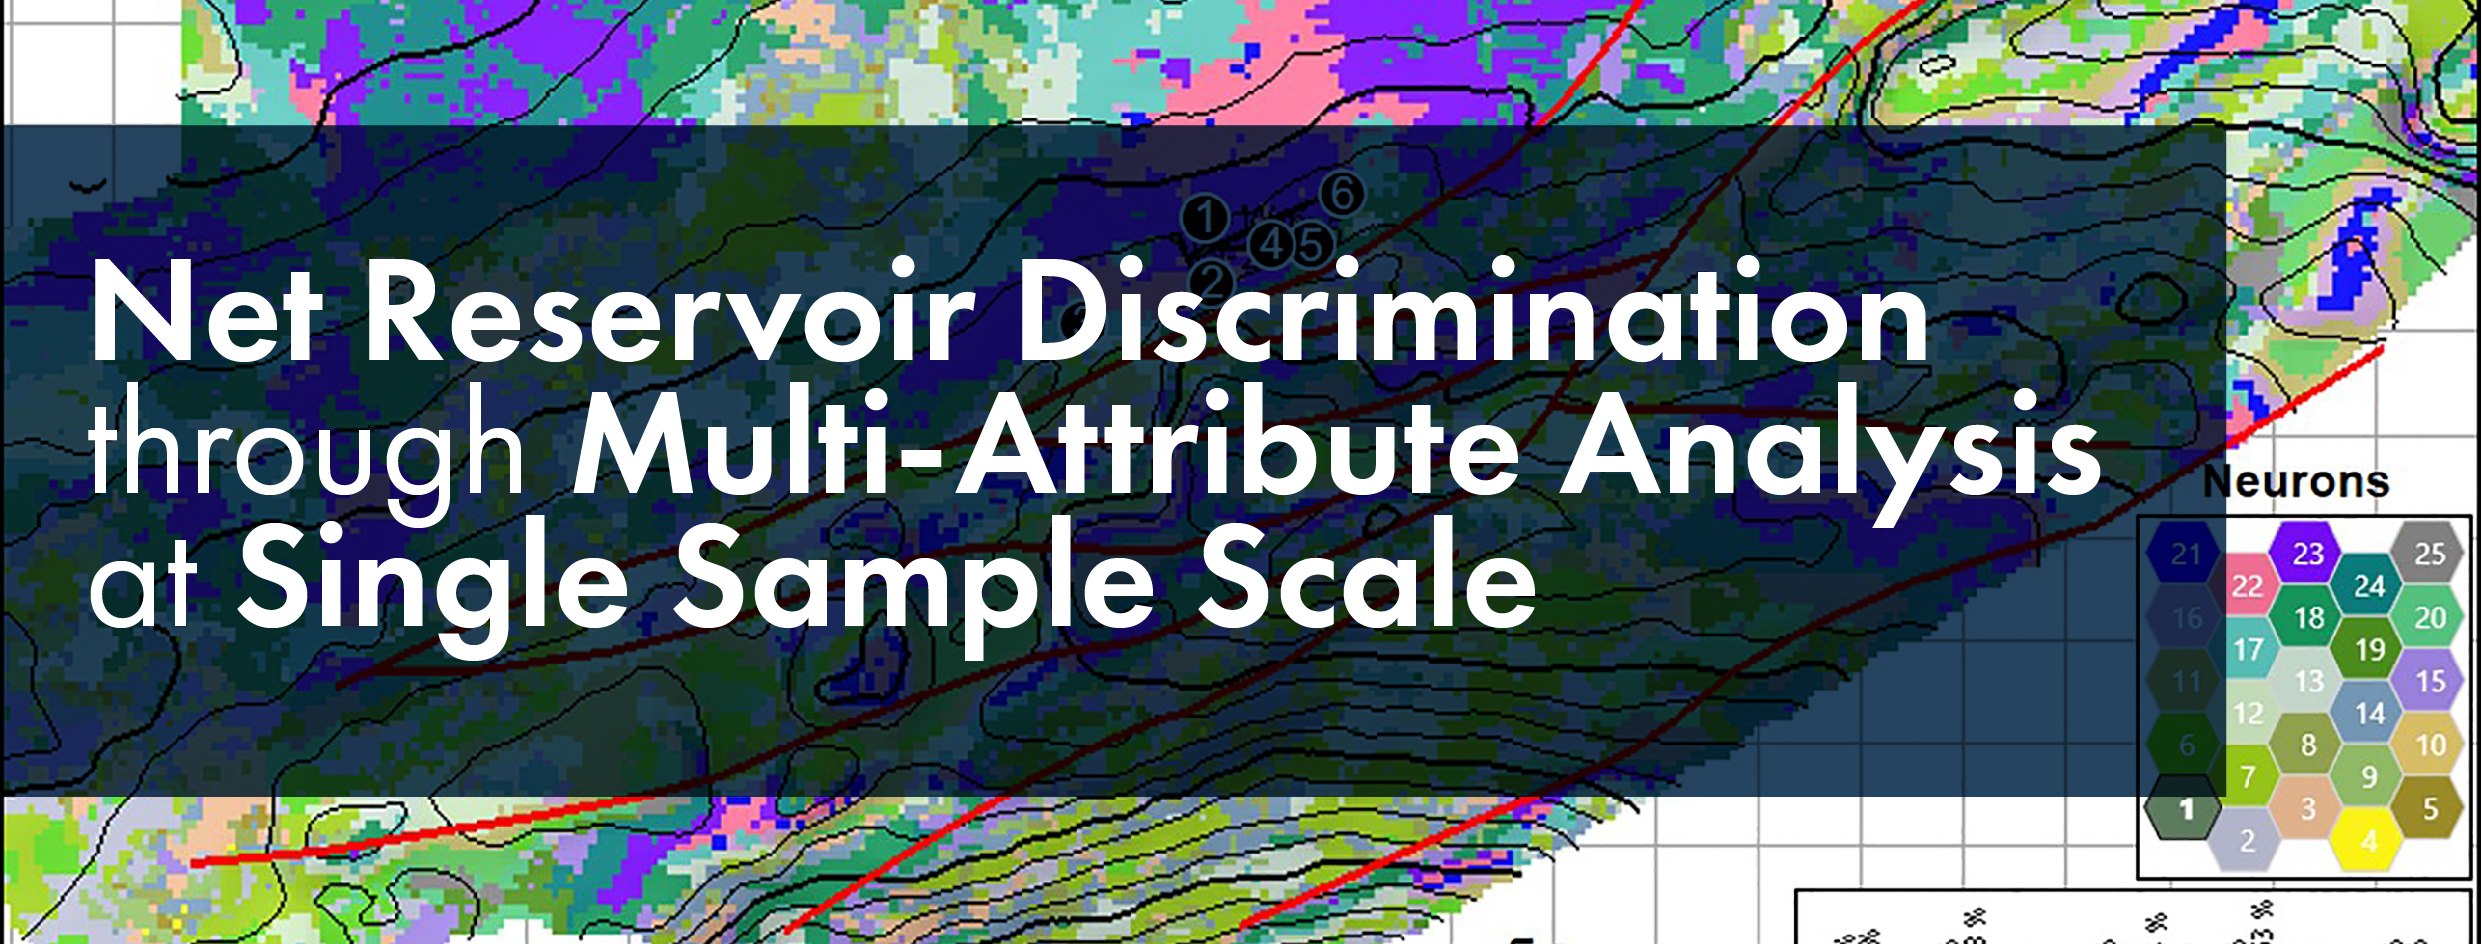
SOM-to-Lithofacies Correlation in Niobrara Formation

The SOM-to-Lithofacies correlation ties the neurons from seismic data to the lithofacies from well logs. In the lower right, the ‘winning’ lithofacies topology shows the lithofacies corresponding to the neurons computed from seismic. The lithofacies from the well are inserted for reference at the well’s location. Multi-client data presented with permission from Geophysical Pursuit, Inc. & Fairfield Geotechnologies.
Step 1: Discovery Call – Schedule Now
Schedule your introductory call to discuss what AI can do for you.
Start your AI implementation journey today with a short, 30-minute introductory call. We will listen carefully to your objectives and design a path for your team that realizes tangible benefits.
Step 1: Discovery Call – Schedule Now
Schedule your introductory call to discuss what AI can do for you.
Start your AI implementation journey today with a short, 30-minute introductory call. We will listen carefully to your objectives and design a path for your team that realizes tangible benefits.


